Net Attendance Ratio in India: What the Numbers Really Show
Posted On:- 06 May, 2025 By:- Vaibhav Maniyar
What Is the Net Attendance Ratio?
Net Attendance Ratio (NAR) is a metric which measures how many children of the official school age are actually attending school and participating in extra-curricular activies. It is expressed as a percentage since it’s used to calculate ratio where you divide the number of children in a specific age group (let’s say 14-16) who attend school for a certain period of time by the total number of children in that age group available in the school, then multiply by 100.
The net percentage helps track whether children are in school at the age they are supposed to be.
Net Attendance vs. Gross Enrollment
As mentioned earlier, the Net Attendance Ratio shows the number of children actually attending school, that too within the same age group taken into account.
On the other hand, Gross Enrollment Ratio counts the total number of students enrolled, regardless of their age. A student may be younger or older than the target age group and still be counted in the total number of students. To put it simply, the NAR focuses only on children in the correct age group who are present in school. But Gross Enrollment takes everything children enrolled regardless of their age, into account.
Why NAR Matters
A high student attendance points to a functional and inclusive school system. A low one shows gaps in access, which may be caused by social or regional issues.
In India, one in four primary school-aged children is not in school at the right time. Most of them attend school later, but not when expected. The problem is worse in rural areas.
In urban regions, about 77% of children of primary school age attend school. In rural areas, that figure drops to 71%. Gender also plays a role. In rural areas, more boys attend school than girls. In urban areas, the gender difference is smaller.
How to Calculate Attendance Percentage
Use this formula:
NAR = (Number of children of official age attending school / Total number of children of that age) × 100
It tracks attendance at the right age for each level of education—primary, secondary, and so on. NAR does not include children who finish school early and move to the next level ahead of schedule.
Related: How to Choose the Right Student Attendance App
Using NAR to Improve Education
NAR helps education planners see where school attendance is low. It shows where action is needed.
It is used to:
Track the progress of education programs.
Spot regional and demographic differences in school attendance.
Focus attention and funding on areas that need help.
NAR is not a full measure of education quality, but it is a reliable tool for tracking attendance by age group. It can guide policy decisions and help improve literacy and access to education.
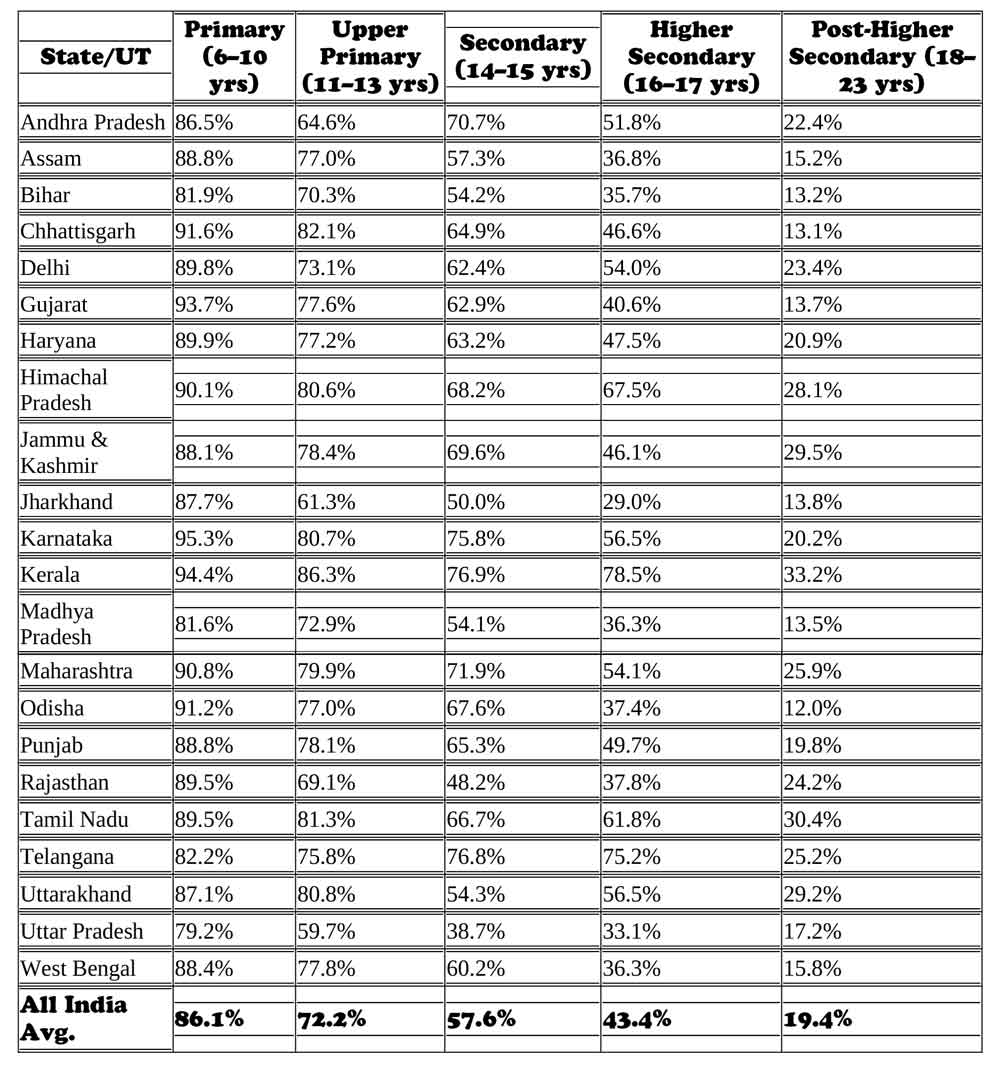
Net Attendance Percentages by States in India
National agencies and surveys collect NAR through household data and school records. In India, NAR data often comes from the National Sample Survey or the Annual Status of Education Report. These surveys ask families about school attendance by age and grade.

These figures indicate that while primary education attendance is relatively high across most states, attendance rates decline at higher levels of education. Kerala and Himachal Pradesh exhibit notably high attendance rates across all educational levels,
Also, about 17 percent of children aged 6 to 10 are not in school at the correct level. The gap widens at higher levels. Dropouts, early marriages, child labour, and long travel times are common causes. Rural children and girls are more likely to miss school. Urban areas report higher NARs.
India's Push for Biometric Attendance
To fix poor attendance and false reporting, many private education institutions has introduced biometric systems in many schools with the help of Minop attendance API. These systems use fingerprints or face recognition to track presence.
Key Features
With biometric attendance, schools can:
Record attendance with precision
Remove proxy attendance
Limit access to authorised users
Prevent data duplication
Send real-time attendance data to parents
Cut the time it takes to mark attendance
Improve overall discipline
Overall, biometric devices help to manage daily attendance with much greater speed, better accuracy, and far-more advanced security. Hence, these systems are already in use in many schools, colleges and higher-studies educational institutions.
What the Government Has Done
Linked student attendance to Aadhaar in many states
Deployed face recognition in pilot schools
Used biometric records to verify teacher presence
Tied attendance data to funding in select programmes
Benefits include:
Timely fund release
Lower chances of error
Simple student verification
Direct transfers to beneficiaries
Better transparency and accountability
Face Recognition in Education
Some schools use face recognition to take attendance. It is fast, contactless, and hard to fake. States in India are now adopting these systems in both public and private institutions. The goal is to improve how attendance is recorded and help reduce dropouts.
Related: Everything You Need to Know About Biometric Time and Attendance Systems
How Biometric Systems Support NAR Goals
Biometric attendance system like Minop:
Help track real presence
Reduce faked records
Show trends in real time
Cut the time spent on manual roll calls
Link with policy tools like Aadhaar and DBT (Direct Benefit Transfer)
Used together, NAR data and biometrics can help ensure each child gets what they are promised.
Conclusion
Net Attendance Ratio is a key metric that shows if children attend school at the right level for their age. In India, the current NAR for primary education stands at 83 percent. This leaves a clear gap that policies must address.
Gross enrolment figures can hide issues. NAR shows them. If we want honest insight into school access and attendance, we must look here first.
Biometric apps also make attendance tracking more accurate and connect presence to benefits. When schools know who is missing, and why, they can act faster. Tracking works best when followed by change.
Frequently Asked Questions
What is Net Attendance Ratio?
It is the percentage of children in the official age group who attend school at the correct level.
How is NAR different from enrolment rate?
NAR looks only at children of the right age in the right class. Enrolment rate counts all students, regardless of age.
What is India’s primary school NAR?
It is currently 83 percent for children aged 6 to 10.
Where does NAR data come from?
From national surveys like NSS and ASER, based on household interviews and school visits.

Comments